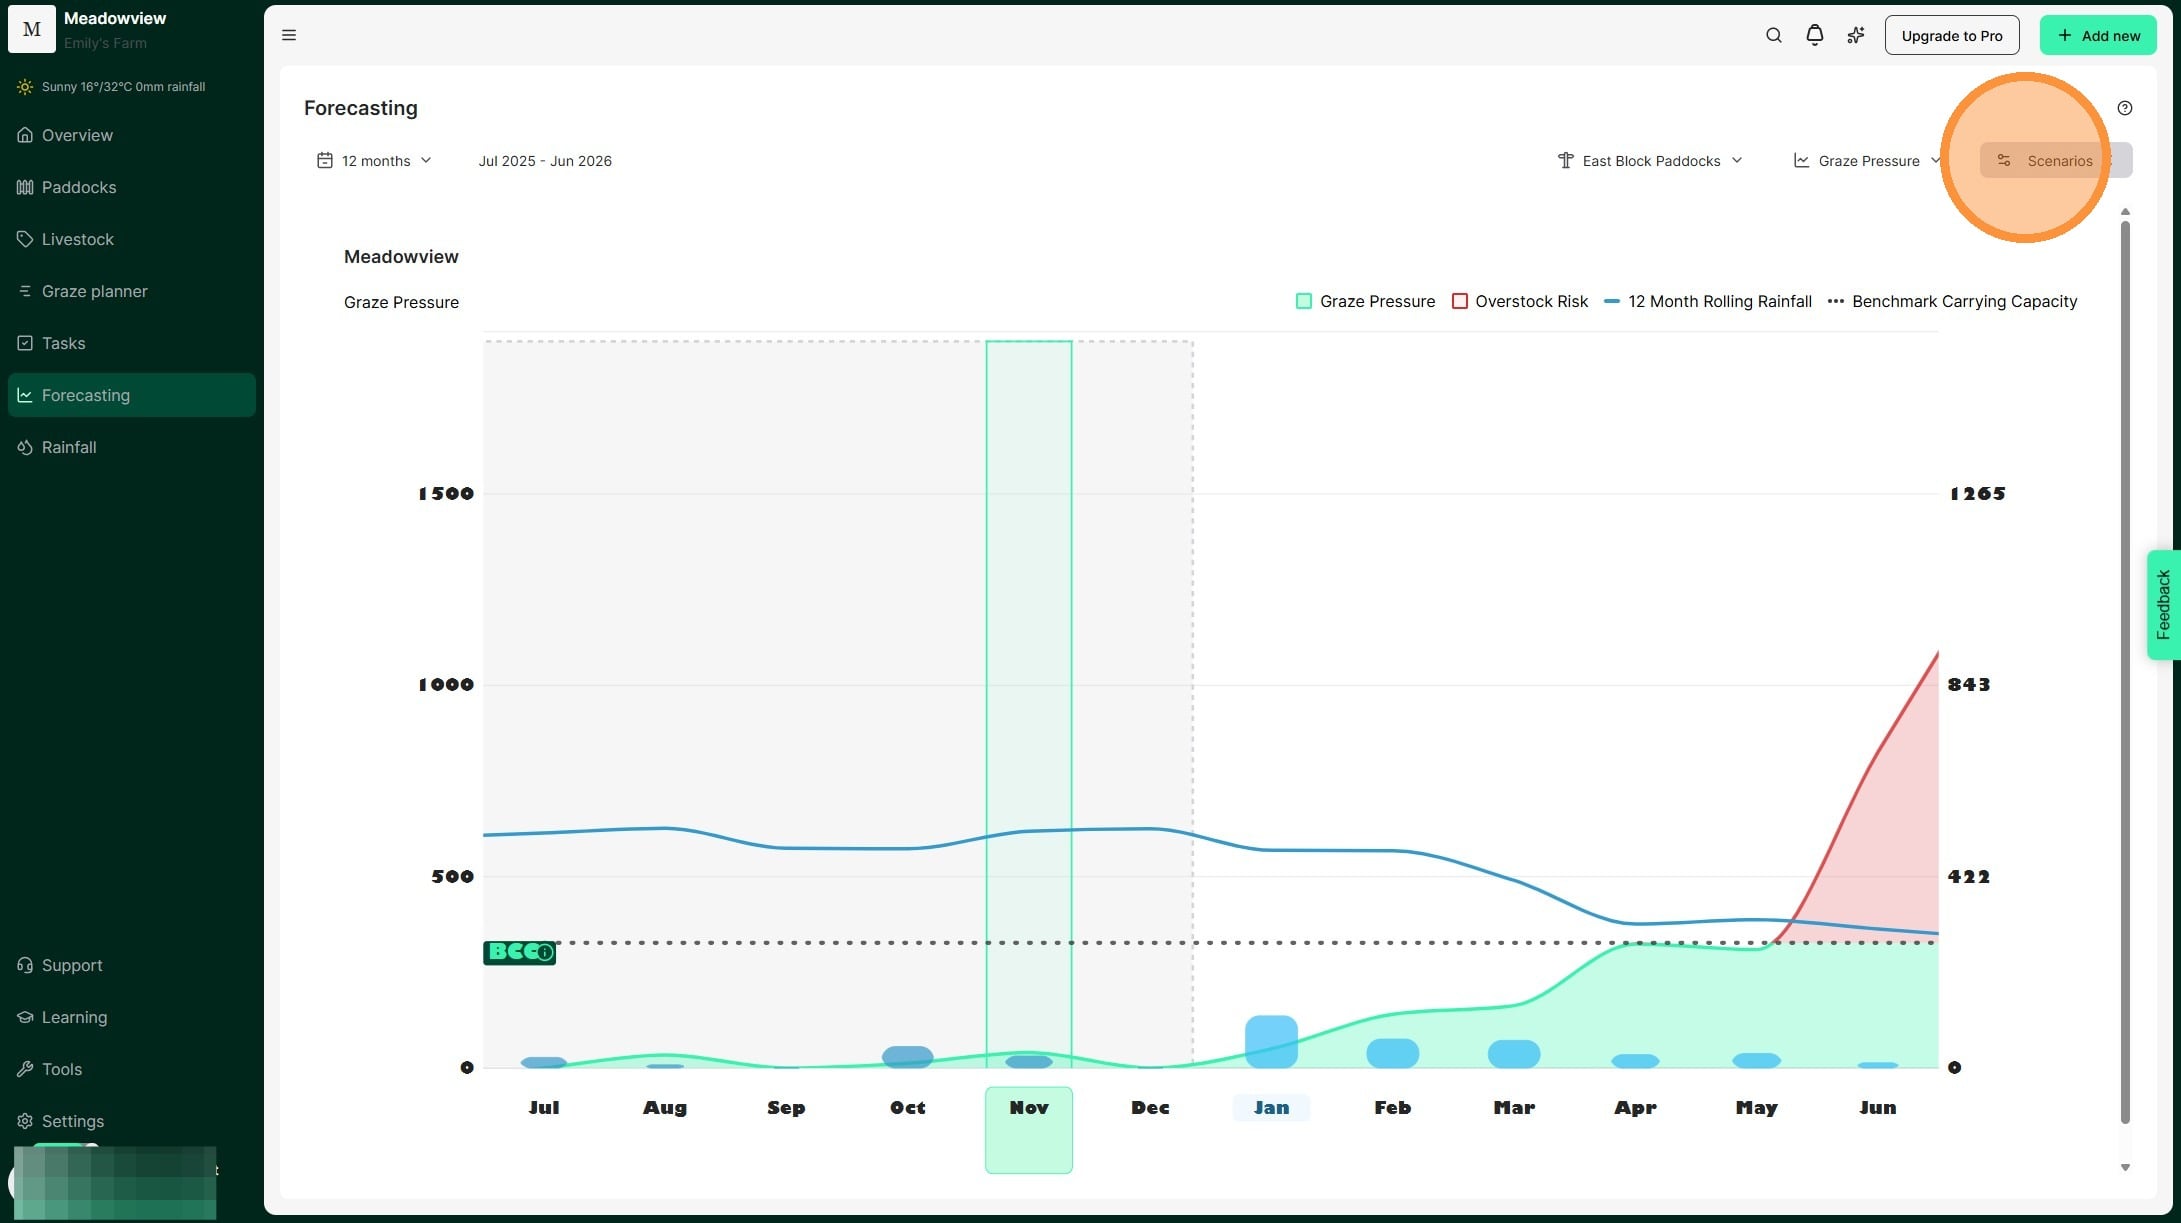
1. Test seasonal scenarios in the Graze Pressure chart by selecting 'Scenarios'. Adjust rainfall and stocking amounts to see how they will affect grazing pressure.
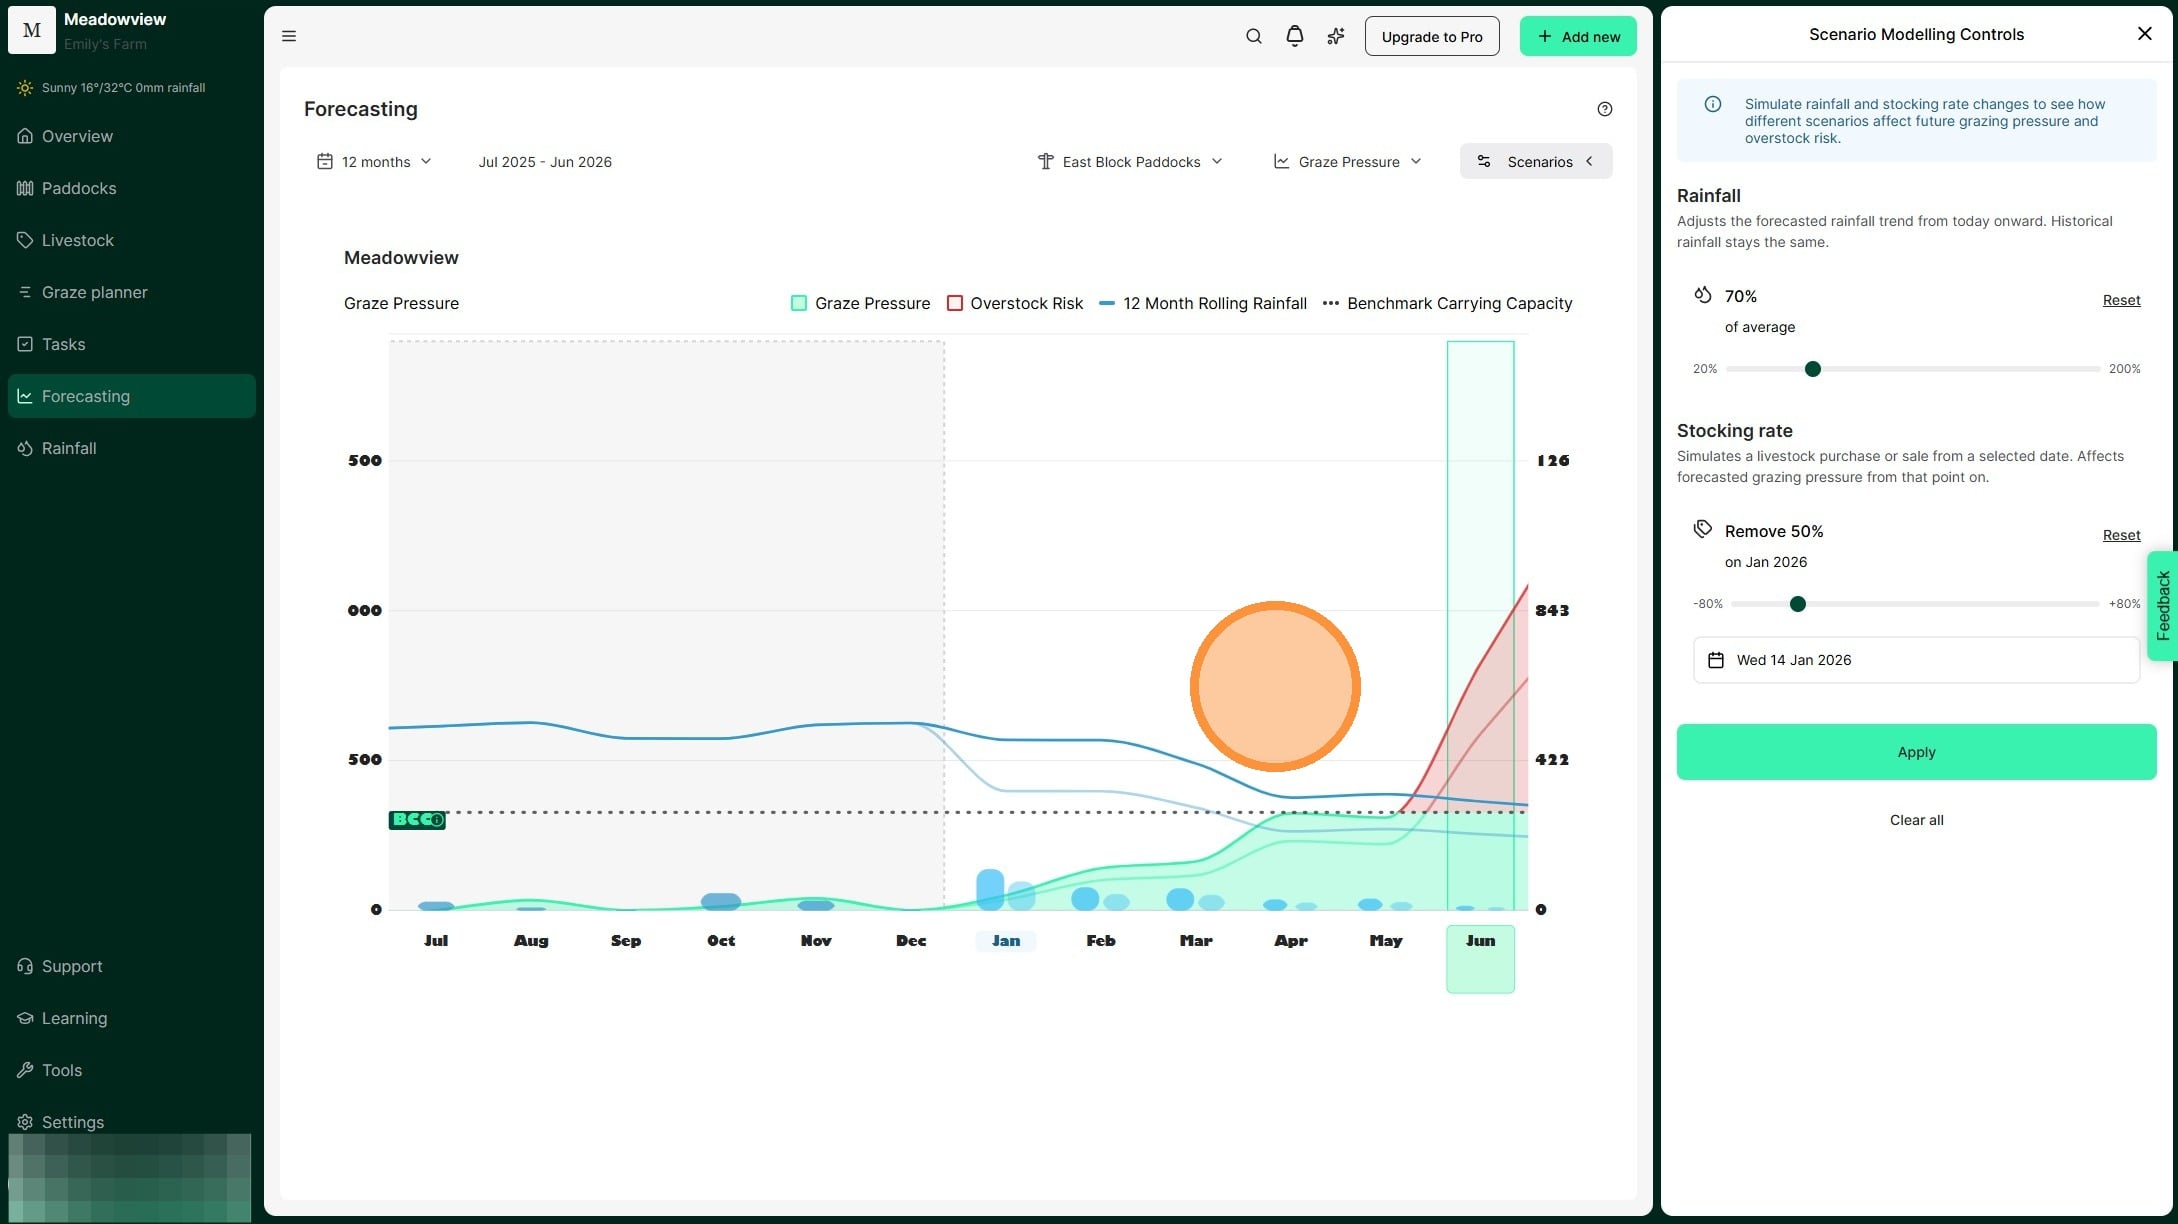
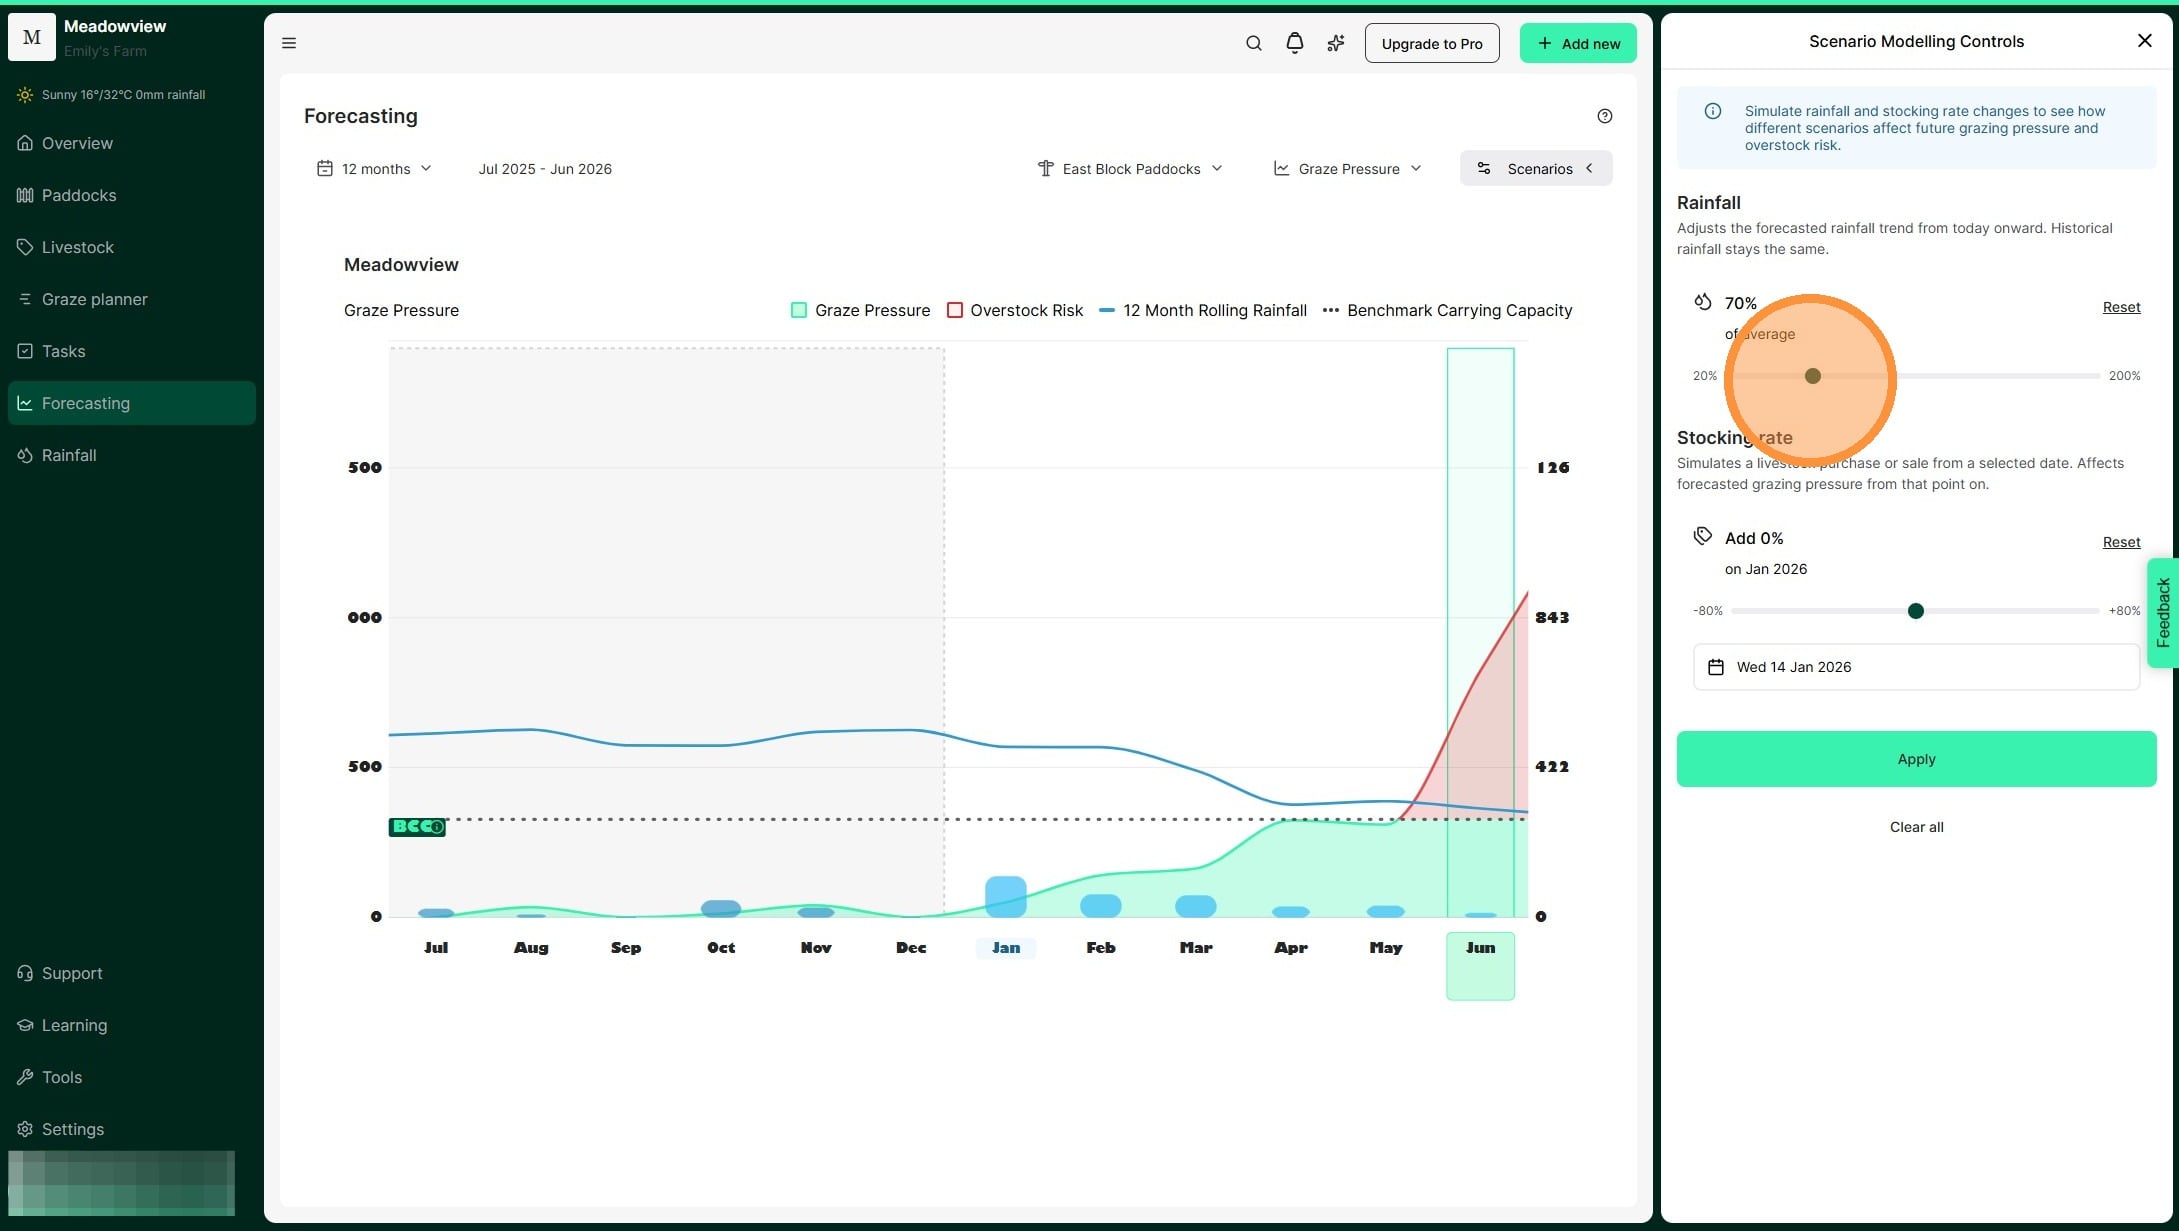
2. The Scenario Modelling Controls window will appear, where you can adjust rainfall and stocking rate for a specific date.
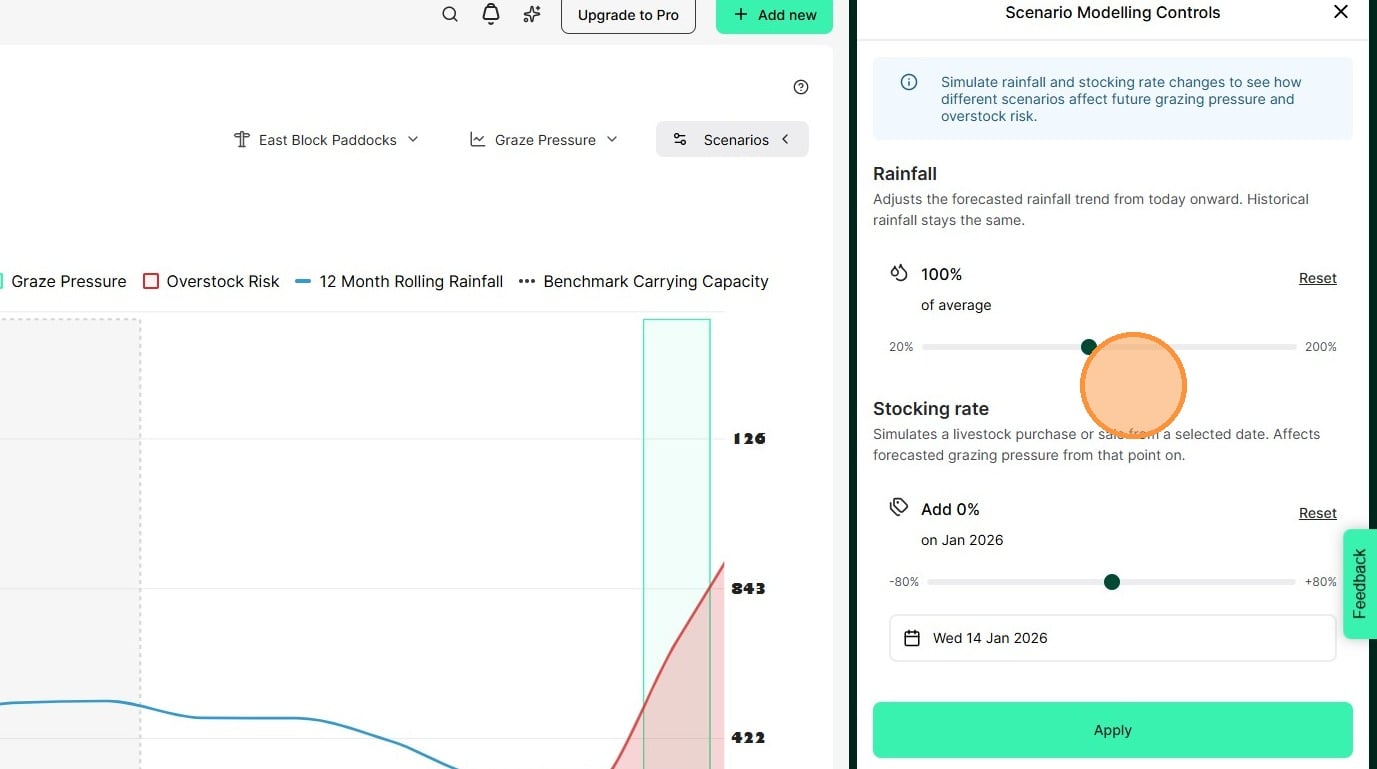
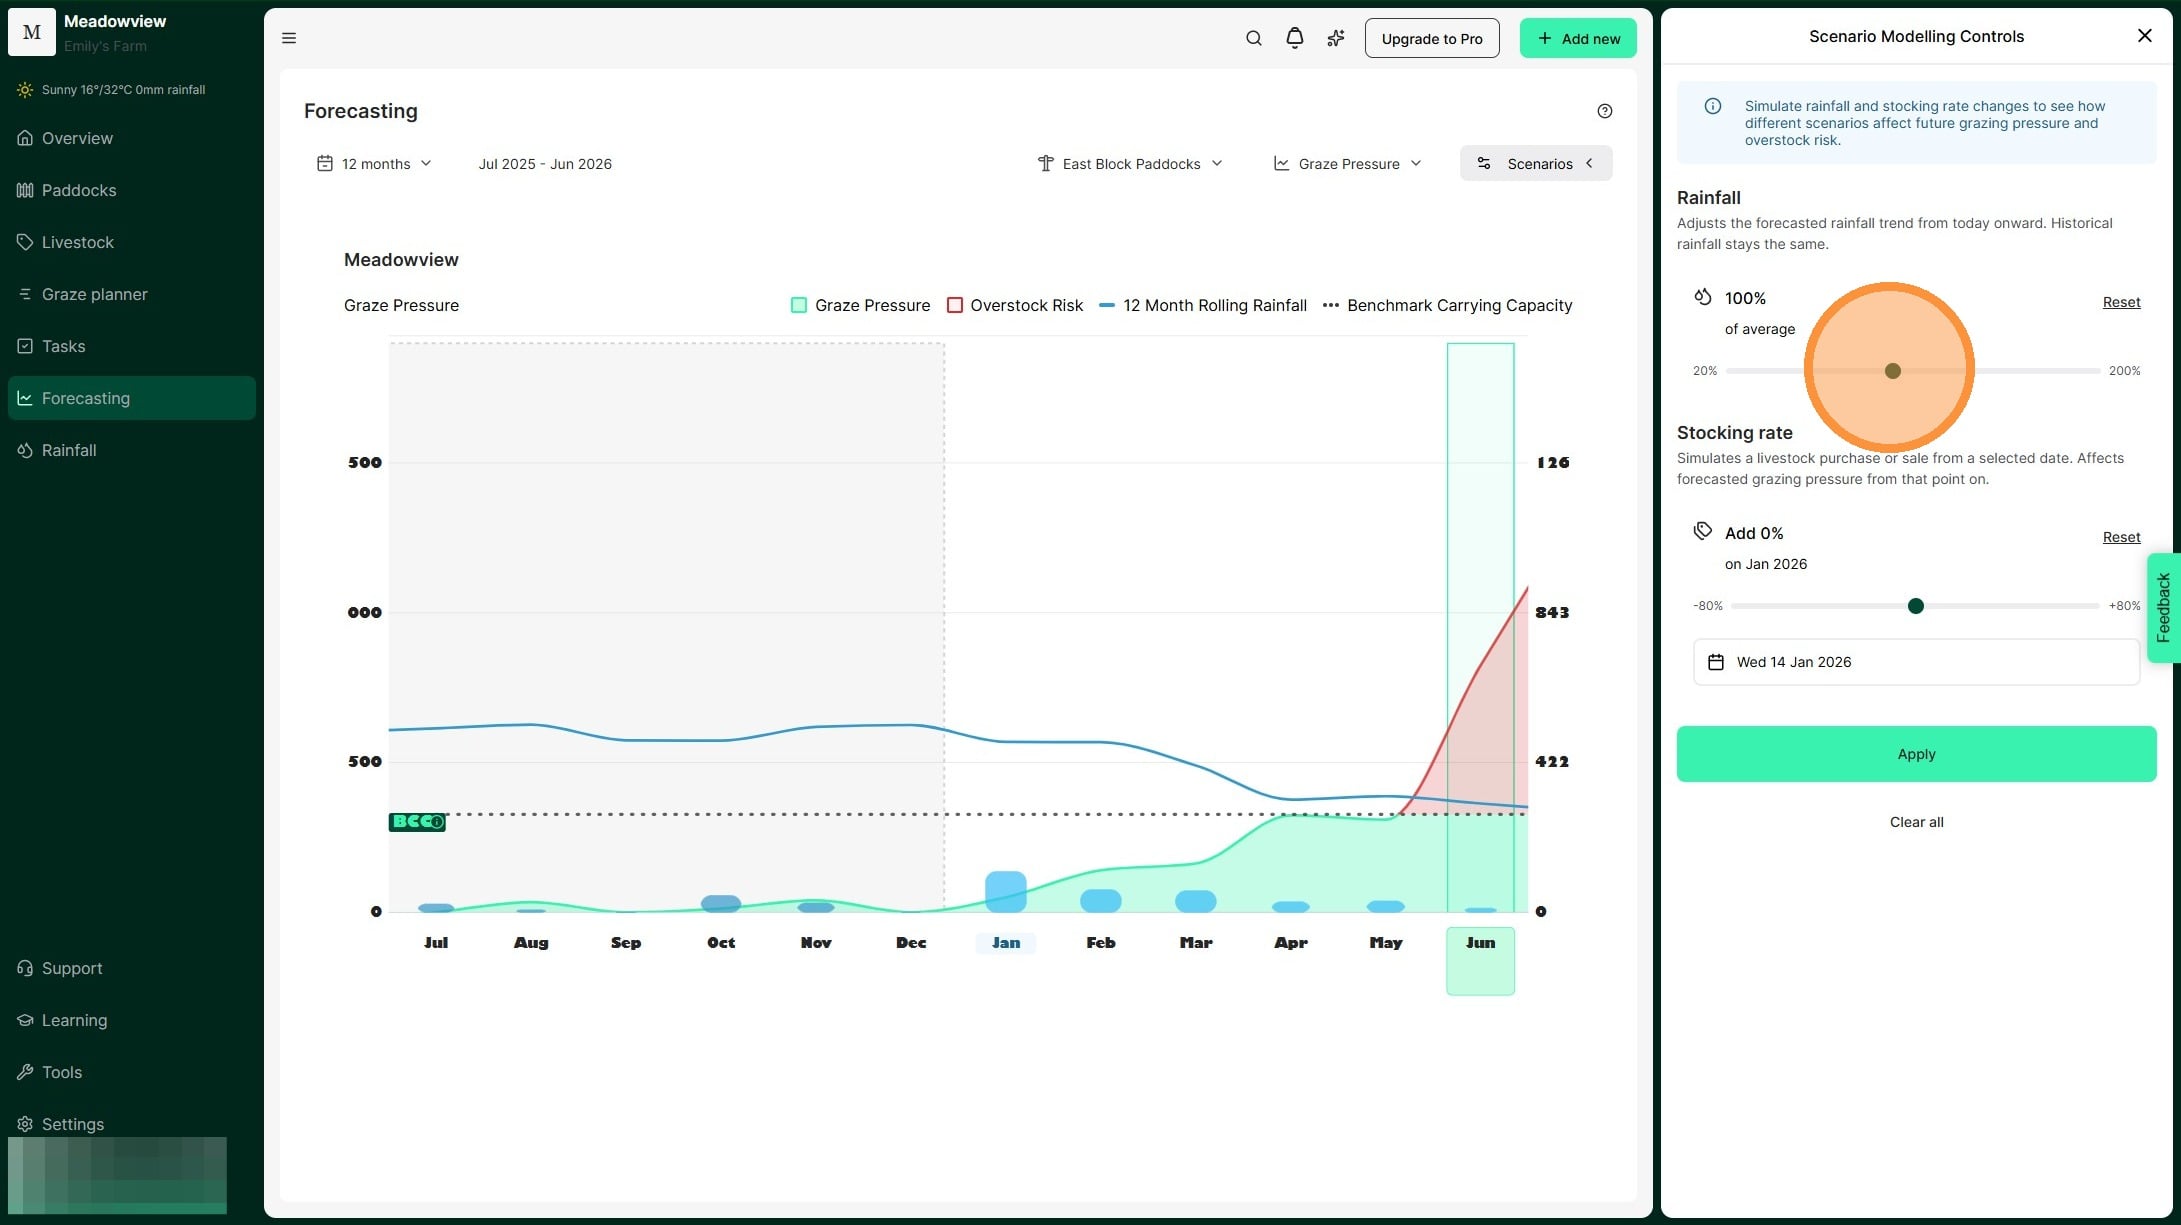
3. [[Move the slider to change expected rainfall. The percentage shows rainfall compared to the long-term average.]] [[This allows you to model either a surplus or deficit of rainfall to forecast the impact on feed availability and plan stocking decisions accordingly. For example, if summer is your non-growing season you may scenario plan for 70% and 50% so that you are prepared to manage through any outcome.]]
4. For example, in this scenario, we are decreasing expected rainfall by 70%.
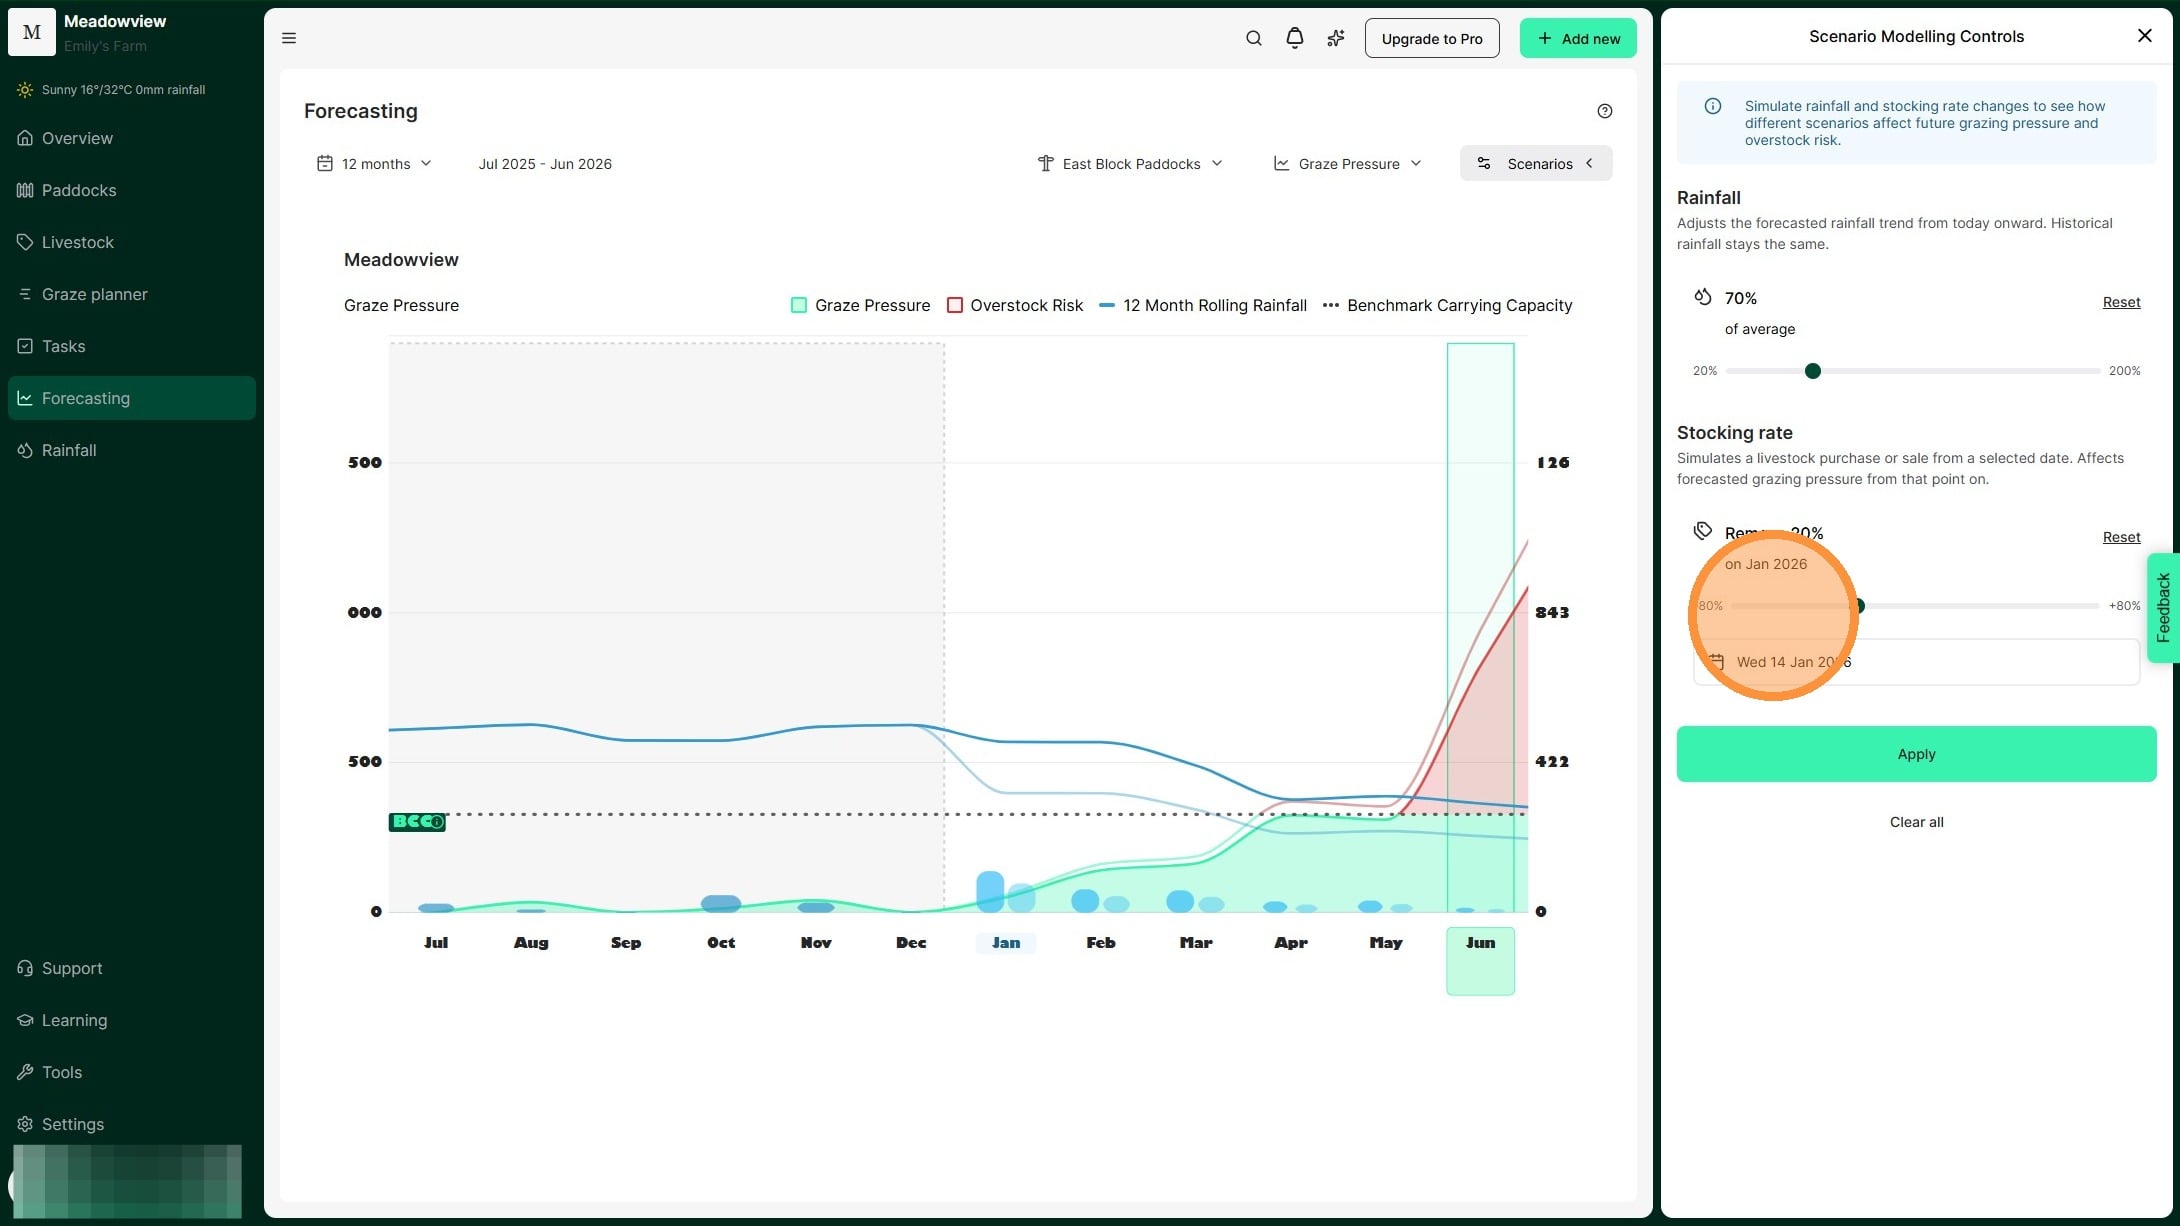
5. Move the second slider to change your stocking rate. This simulates adding or removing livestock. Using the scenario of receiving 70% of our average rainfall, we can see that there is a 30% overstocking risk. This helps us to model the amount of demand we need to destock and mitigate the risk of overstocking.
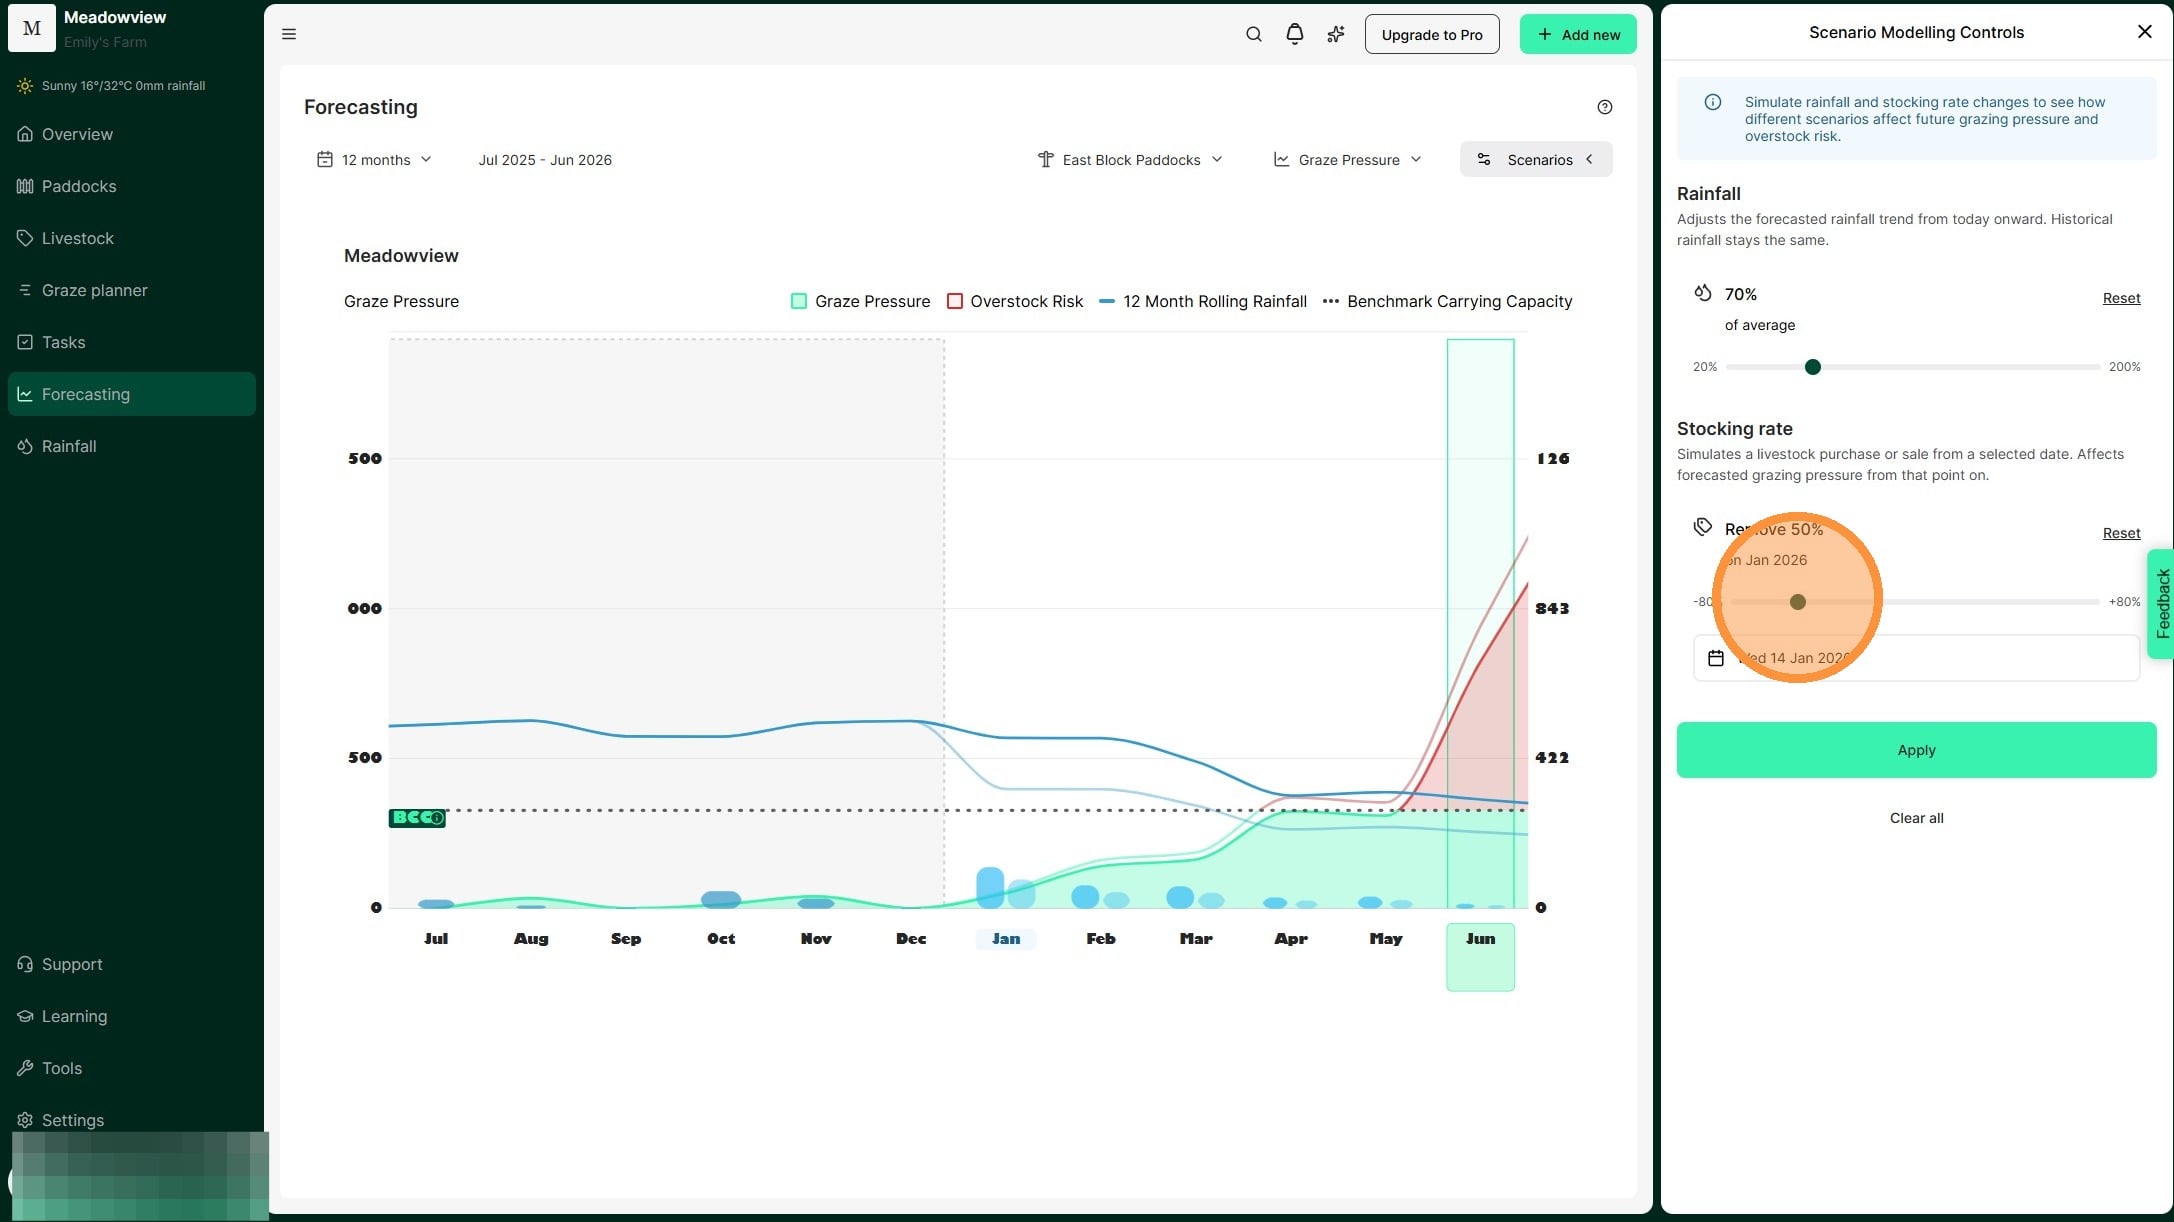
6. For example, in this scenario, we are reducing the stocking rate by 50%.
7. Select "Apply"
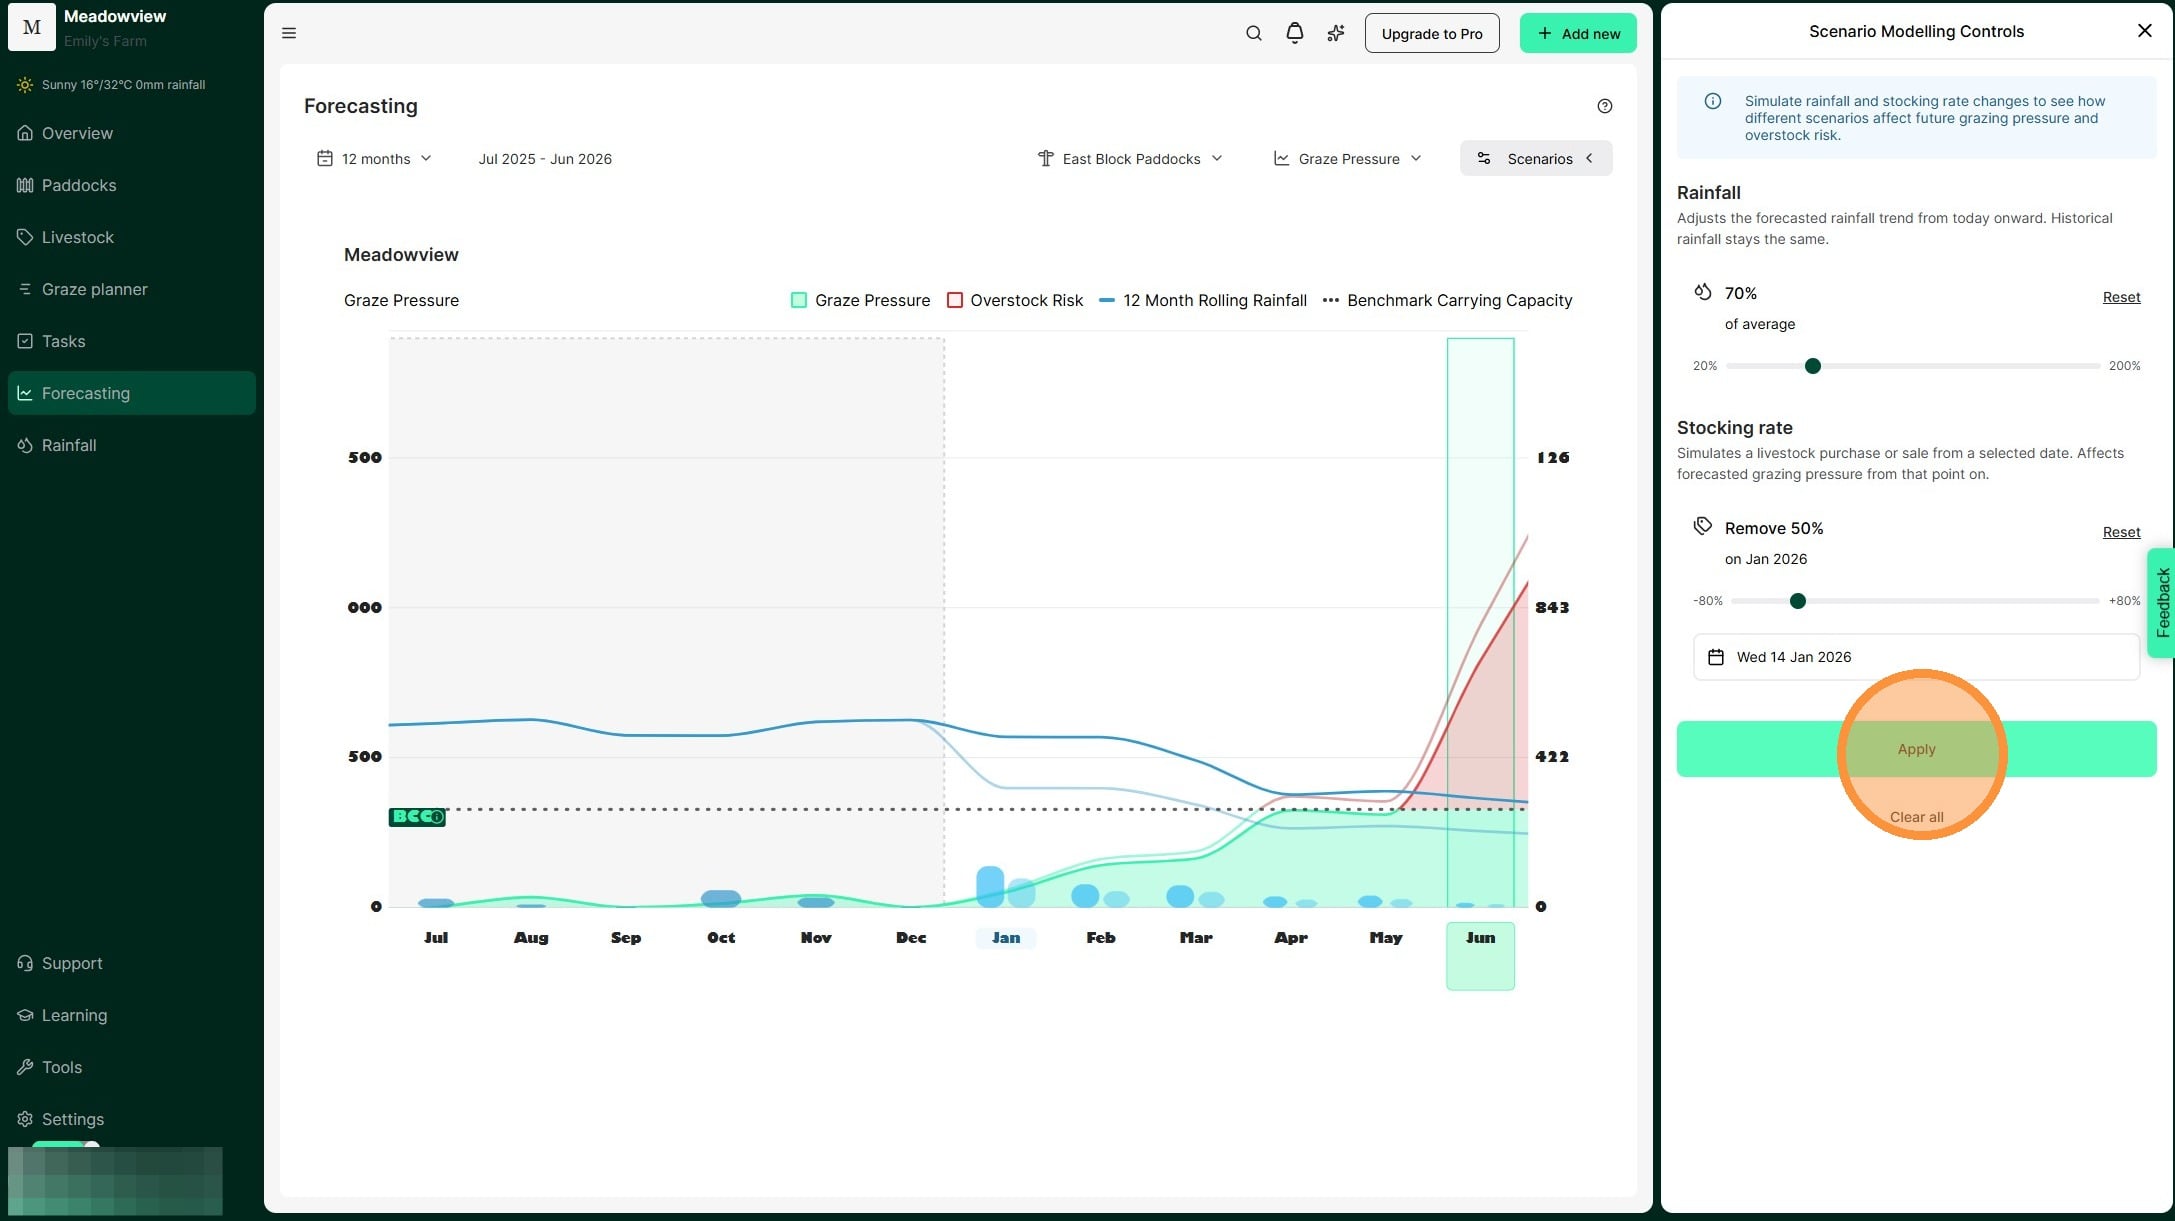
8. Your scenario now appears on the Graze Pressure chart.We can see the impact of rainfall received and our stocking rate decisions modelled by the lighter blue and green/red lines.
This tool allows us to "model" seasonal scenarios and plan for the optimum time to adjust stocking rate. Ultimately, this means we can reduce the chance of overstocking and the impacts of extended dry periods.